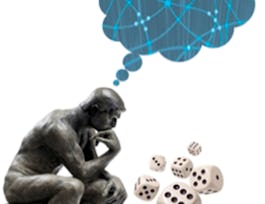
Probabilistic graphical models (PGMs) are a rich framework for encoding probability distributions over complex domains: joint (multivariate) distributions over large numbers of random variables that interact with each other. These representations sit at the intersection of statistics and computer science, relying on concepts from probability theory, graph algorithms, machine learning, and more. They are the basis for the state-of-the-art methods in a wide variety of applications, such as medical diagnosis, image understanding, speech recognition, natural language processing, and many, many more. They are also a foundational tool in formulating many machine learning problems.


Probabilistic Graphical Models 1: Representation
This course is part of Probabilistic Graphical Models Specialization
Taught in English
Some content may not be translated

Instructor: Daphne Koller
89,485 already enrolled
Course
(1,426 reviews)
83%
Skills you'll gain
Details to know

Add to your LinkedIn profile
12 quizzes
Course
(1,426 reviews)
83%
See how employees at top companies are mastering in-demand skills

Build your subject-matter expertise
- Learn new concepts from industry experts
- Gain a foundational understanding of a subject or tool
- Develop job-relevant skills with hands-on projects
- Earn a shareable career certificate


Earn a career certificate
Add this credential to your LinkedIn profile, resume, or CV
Share it on social media and in your performance review

There are 7 modules in this course
This module provides an overall introduction to probabilistic graphical models, and defines a few of the key concepts that will be used later in the course.
What's included
4 videos1 quiz
In this module, we define the Bayesian network representation and its semantics. We also analyze the relationship between the graph structure and the independence properties of a distribution represented over that graph. Finally, we give some practical tips on how to model a real-world situation as a Bayesian network.
What's included
15 videos6 readings3 quizzes1 programming assignment
In many cases, we need to model distributions that have a recurring structure. In this module, we describe representations for two such situations. One is temporal scenarios, where we want to model a probabilistic structure that holds constant over time; here, we use Hidden Markov Models, or, more generally, Dynamic Bayesian Networks. The other is aimed at scenarios that involve multiple similar entities, each of whose properties is governed by a similar model; here, we use Plate Models.
What's included
4 videos1 quiz
A table-based representation of a CPD in a Bayesian network has a size that grows exponentially in the number of parents. There are a variety of other form of CPD that exploit some type of structure in the dependency model to allow for a much more compact representation. Here we describe a number of the ones most commonly used in practice.
What's included
4 videos2 quizzes1 programming assignment
In this module, we describe Markov networks (also called Markov random fields): probabilistic graphical models based on an undirected graph representation. We discuss the representation of these models and their semantics. We also analyze the independence properties of distributions encoded by these graphs, and their relationship to the graph structure. We compare these independencies to those encoded by a Bayesian network, giving us some insight on which type of model is more suitable for which scenarios.
What's included
7 videos2 quizzes1 programming assignment
In this module, we discuss the task of decision making under uncertainty. We describe the framework of decision theory, including some aspects of utility functions. We then talk about how decision making scenarios can be encoded as a graphical model called an Influence Diagram, and how such models provide insight both into decision making and the value of information gathering.
What's included
3 videos2 quizzes1 programming assignment
This module provides an overview of graphical model representations and some of the real-world considerations when modeling a scenario as a graphical model. It also includes the course final exam.
What's included
1 video1 quiz
Instructor

Offered by
Recommended if you're interested in Machine Learning

Stanford University

Stanford University

Stanford University

Google Cloud
Why people choose Coursera for their career


Learner reviews
Showing 3 of 1426
1,426 reviews
- 5 stars
74.54%
- 4 stars
17.88%
- 3 stars
5.25%
- 2 stars
1.05%
- 1 star
1.26%
New to Machine Learning? Start here.

Open new doors with Coursera Plus
Unlimited access to 7,000+ world-class courses, hands-on projects, and job-ready certificate programs - all included in your subscription
Advance your career with an online degree
Earn a degree from world-class universities - 100% online
Join over 3,400 global companies that choose Coursera for Business
Upskill your employees to excel in the digital economy
Frequently asked questions
Apply the basic process of representing a scenario as a Bayesian network or a Markov network
Analyze the independence properties implied by a PGM, and determine whether they are a good match for your distribution
Decide which family of PGMs is more appropriate for your task
Utilize extra structure in the local distribution for a Bayesian network to allow for a more compact representation, including tree-structured CPDs, logistic CPDs, and linear Gaussian CPDs
Represent a Markov network in terms of features, via a log-linear model
Encode temporal models as a Hidden Markov Model (HMM) or as a Dynamic Bayesian Network (DBN)
Encode domains with repeating structure via a plate model
Represent a decision making problem as an influence diagram, and be able to use that model to compute optimal decision strategies and information gathering strategies
Honors track learners will be able to apply these ideas for complex, real-world problems
Access to lectures and assignments depends on your type of enrollment. If you take a course in audit mode, you will be able to see most course materials for free. To access graded assignments and to earn a Certificate, you will need to purchase the Certificate experience, during or after your audit. If you don't see the audit option:
The course may not offer an audit option. You can try a Free Trial instead, or apply for Financial Aid.
The course may offer 'Full Course, No Certificate' instead. This option lets you see all course materials, submit required assessments, and get a final grade. This also means that you will not be able to purchase a Certificate experience.
When you enroll in the course, you get access to all of the courses in the Specialization, and you earn a certificate when you complete the work. Your electronic Certificate will be added to your Accomplishments page - from there, you can print your Certificate or add it to your LinkedIn profile. If you only want to read and view the course content, you can audit the course for free.

